サンプルコード
import chartify
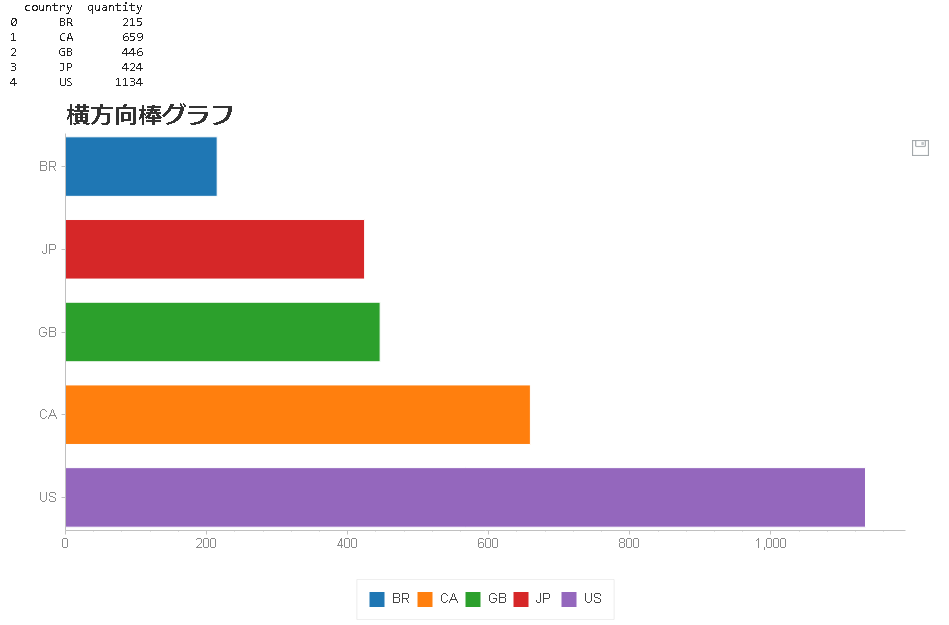
data = chartify.examples.example_data()
bar_data = data.groupby('country')[['quantity']].sum().reset_index()
print(bar_data)
ch = chartify.Chart(blank_labels=True, y_axis_type='categorical')
ch.set_title("横方向棒グラフ")
ch.plot.bar(data_frame=bar_data, categorical_columns='country', numeric_column='quantity', color_column='country')
ch.set_legend_location("outside_bottom")
ch.show()
〇出力画像
インストール方法
Jupyterの仮想環境で以下のコマンドを実行します。pipenv install chartify関連情報
・Chartifyのgithubリポジトリhttps://github.com/spotify/chartify
0 件のコメント:
コメントを投稿