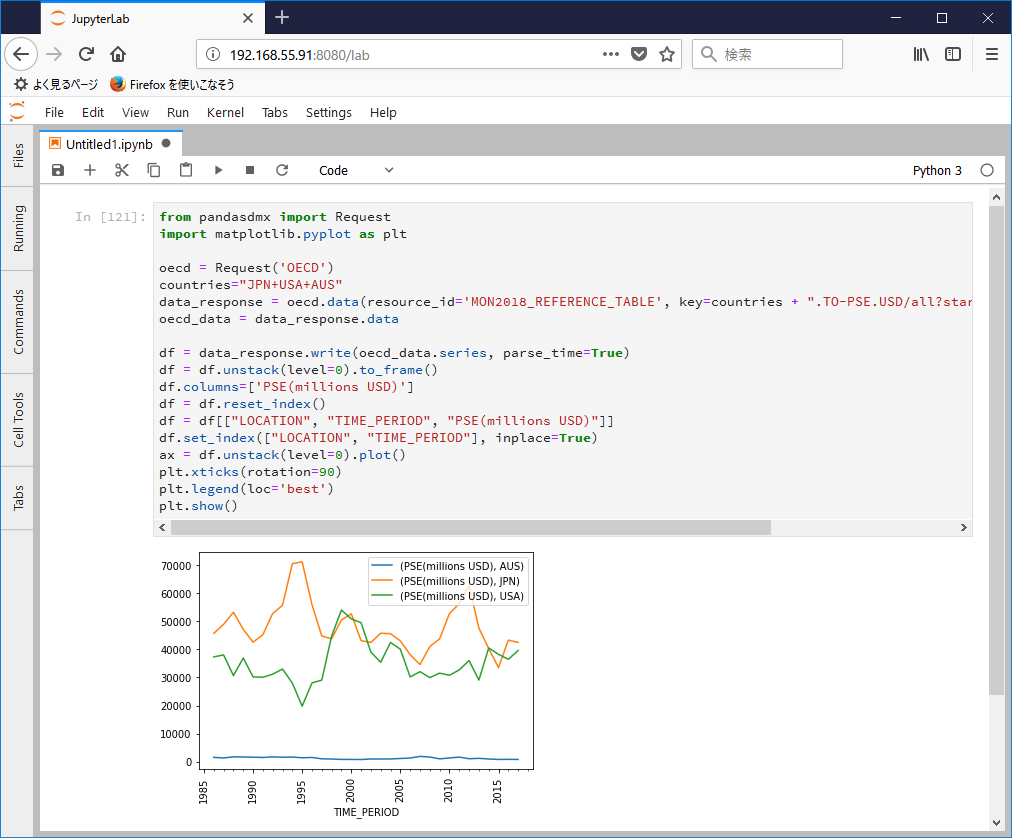
〇出力グラフ
〇コード
from pandasdmx import Request
import matplotlib.pyplot as plt

oecd = Request('OECD')
countries="JPN+USA+AUS"
data_response = oecd.data(resource_id='MON2018_REFERENCE_TABLE', key=countries + ".TO-PSE.USD/all?startTime=1986&endTime=2017")
oecd_data = data_response.data

df = data_response.write(oecd_data.series, parse_time=True)
df = df.unstack(level=0).to_frame()
df.columns=['PSE(millions USD)']
df = df.reset_index()
df = df[["LOCATION", "TIME_PERIOD", "PSE(millions USD)"]]
df.set_index(["LOCATION", "TIME_PERIOD"], inplace=True)
ax = df.unstack(level=0).plot()
plt.xticks(rotation=90)
plt.legend(loc='best')
plt.show()
〇元データ
2018 - Monitoring and evaluation : Reference Tables
https://stats.oecd.org/Index.aspx?DataSetCode=MON2018_REFERENCE_TABLE
○関連情報
・Pandasdmxに関する他の記事はこちらを参照してください。
0 件のコメント:
コメントを投稿